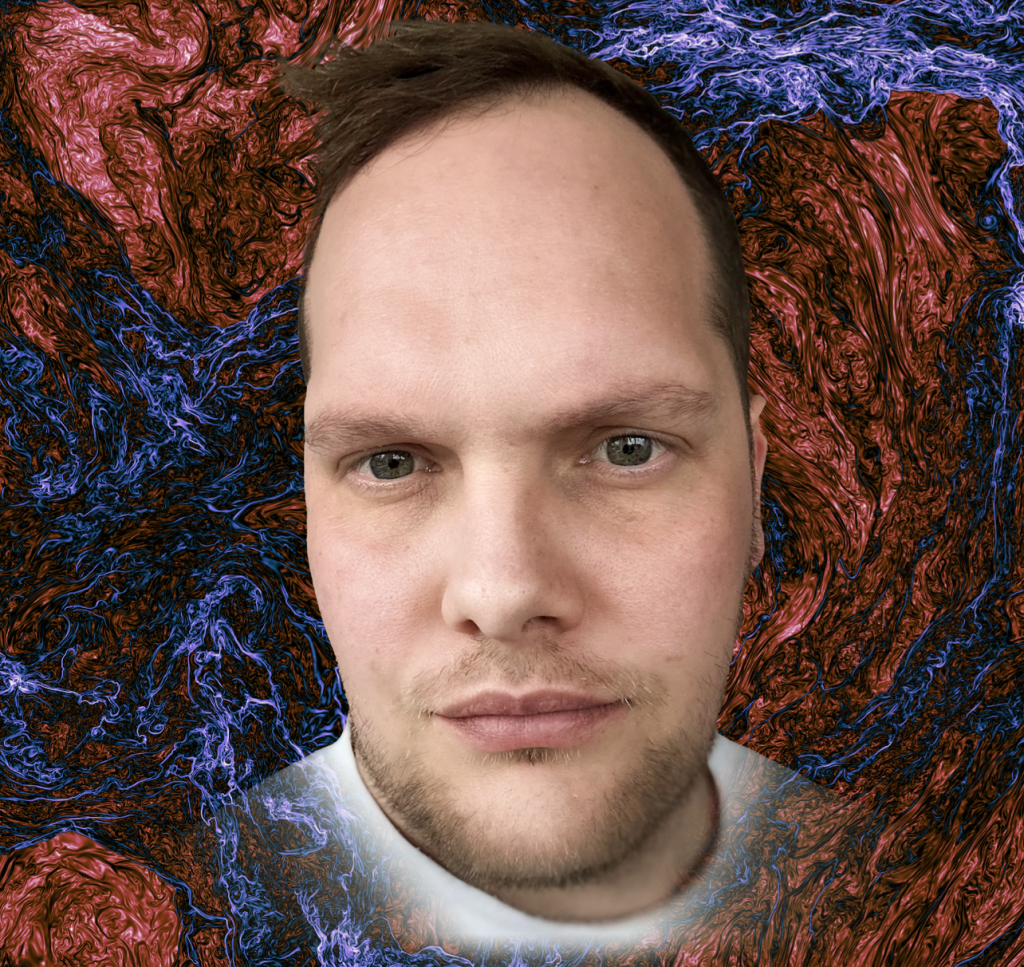
Van Gogh’s depiction of the starry night closely resembles the turbulence found between the stars in our Galaxy
By Lyuba Encheva, Canadian Institute for Theoretical Astrophysics
 “Van Gogh’s depiction of the starry night closely resembles the turbulence found in between the stars in our Galaxy”, explains CITA/ Princeton Postdoctoral Fellow James Beattie for CNN.
The impressionistic painting of Van Gogh is not just an artist’s rendition of a summer night’s sky. As it turns out, the scrutiny of an artist’s gaze is akin to that of a scientist observing natural phenomena. What the former expresses in colours and brushstrokes, the later describes in mathematical formulas.
In a 2019 publication entitled “Is The Starry Night Turbulent?” (arXiv:1902.03381), James Beattie, a CITA and Princeton Postdoctoral Fellow and colleague Neco Kriel from the Australian National University demonstrate the mathematical correlation between van Gogh’s spiral-shaped stars and Kolmogorov (1941)’s description of subsonic, incompressible turbulence.
“I deeply love the fact that I can take my understanding of the turbulence in the plasma between galaxies and apply it to the turbulence between stars, between Earth and the Sun or in our own lakes, oceans and atmosphere,” CITA Fellow James Beattie shared in an interview for CNN.
“What I take away from studies like this is that (van Gogh) captured some of this universality in the beautiful (‘Starry Night’),” Beattie added. “And I think people know this. They know that something wonderful has been embedded in this painting and we are drawn to it.”
More recently, another team of scholars from the State Key Laboratory of Marine Environmental Science & College of Ocean and Earth Sciences at Xiamen University also confirmed that turbulent patterns captured by artists and studied by physicists can be described through the same mathematical equations. In addition to Van Gough’s “The Starry Night”, the team also analysed the cloud patterns in “Chain Pier, Brighton” (1826) by British artist John Constable and a photograph of Jupiter’s Great Red Spot, taken by NASA’s Voyager 1 spacecraft on March 5, 1979.
“Imagine you are standing on a bridge, and you watch the river flow. You will see swirls on the surface, and these swirls are not random. They arrange themselves in specific patterns, and these kinds of patterns can be predicted by physical laws,” said for CNN Yongxiang Huang, lead author of the study that published in the scientific journal Physics of Fluids.

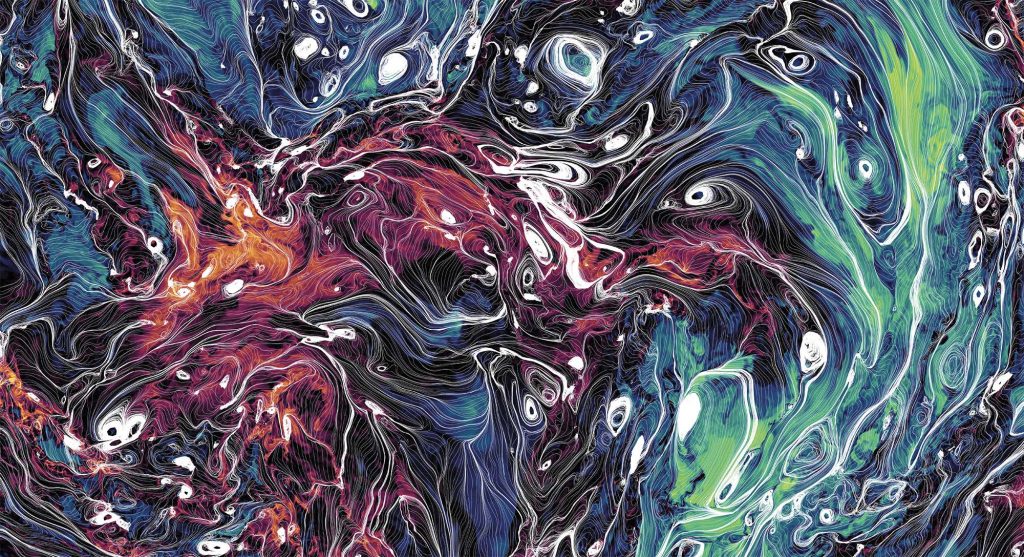
The chaotic twists and swirls from a two-dimensional slice of the mass density field and magnetic streamlines (shown in white) from one of Beattie’s three-dimensional simulations of magnetized turbulence — the largest simulations of their kind in the world (https://arxiv.org/abs/2405.16626).
Read more on CNN Science News, UofT News and Substack.