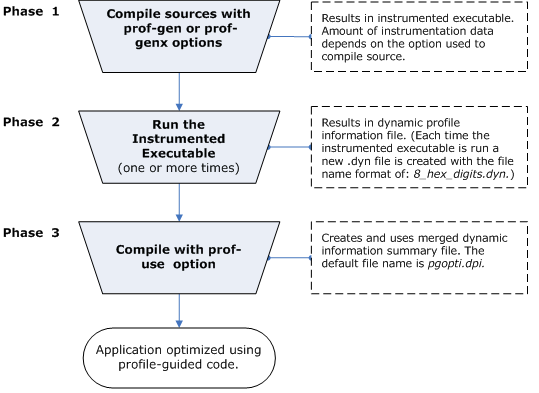
Profile-Guided Optimization consists of three phases (or steps):
Generating instrumented code and linking with the -prof-gen (Linux* and Mac OS*) or /Qprof-gen (Windows*) option.
Running the instrumented executable, which produces dynamic-information (.dyn) files.
Compiling the application using the profile information using the -prof-use (Linux and Mac OS) or /Qprof-use (Windows) option.
The figure illustrates the phases and the results of each phase.
See Profile an Application for details about using each phase.
The following table lists the compiler options used in PGO:
Linux* and Mac OS* |
Windows* |
Effect |
|---|---|---|
|
-prof-gen |
/Qprof-gen |
Instruments a program for profiling to get the execution count of each basic block. The option is used in phase 1 (instrumenting the code) to instruct the compiler to produce instrumented code in your object files in preparation for instrumented execution. Results in dynamic-information (.dyn) file. With the x qualifier, the option gathers extra source information, which enables using specific tools, like the code-coverage tool. The extended option does not provide better optimization and using it could slow compile time. If you are performing a parallel make, this option will not affect it. For more information, see the following topic:
|
|
-prof-use |
/Qprof-use |
Instructs the compiler to produce a profile-optimized executable and merges available dynamic-information (.dyn) files into a pgopti.dpi file. This option is used in used in phase 3 (generating a profile-optimized executable). The dynamic-information files are produced in phase 2 when you run the instrumented executable. If you perform multiple executions of the instrumented program, this option merges the dynamic-information files again and overwrites the previous pgopti.dpi file. Linux:
For more information, see the following topic:
|
|
-fnsplit- |
/Qfnsplit- |
Disables function splitting. Function splitting is enabled by the prof-use option in phase 3 to improve code locality by splitting routines into different sections: one section to contain the cold or very infrequently executed (cold) code, and one section to contain the rest of the frequently executed (hot) code. You may want to disable function splitting for the following reasons:
Mac OS: This option is not supported. Windows: This option behaves differently on systems based on IA-32 architecture that it does on systems based on IA-64 architecture. IA-32 architecture:
IA-64 architecture:
For more information, see the following topic:
|
|
-prof-dir |
/Qprof-dir |
Specifies the directory in which dynamic information (.dyn) files are created and stored; otherwise, the .dyn files are placed in the directory where the program is compiled. For more information, see the following topic:
|
|
-prof-file |
/Qprof-file |
Specifies file name for profiling summary file. If this option is not specified the summary information is stored in the default file: pgopti.dpi. For more information, see the following topic:
|
|
-prof-gen-sampling |
/Qprof-gen-sampling |
IA-32 architecture. Prepares application executables for hardware profiling (sampling) and causes the compiler to generate source code mapping information. Mac OS: This option is not supported. For more information, see the following topic:
|
|
-ssp
|
/Qssp
|
IA-32 architecture. Enables Software-based Speculative Pre-computation (SSP) optimization. Mac OS: This option is not supported. For more information, see the following topic:
|
|
-finstrument-functions |
/Qinstrument-functions |
Enables the ability to gather information about developer-created profiling functions. Enables inlining for a specific function even if inlining has been disabled for the compilation. For more information, see the following topic:
|
Refer to Quick Reference Lists for a complete listing of the quick reference topics.