HOTT (Herschel Optimized Tau and Temperature) Maps
Summary
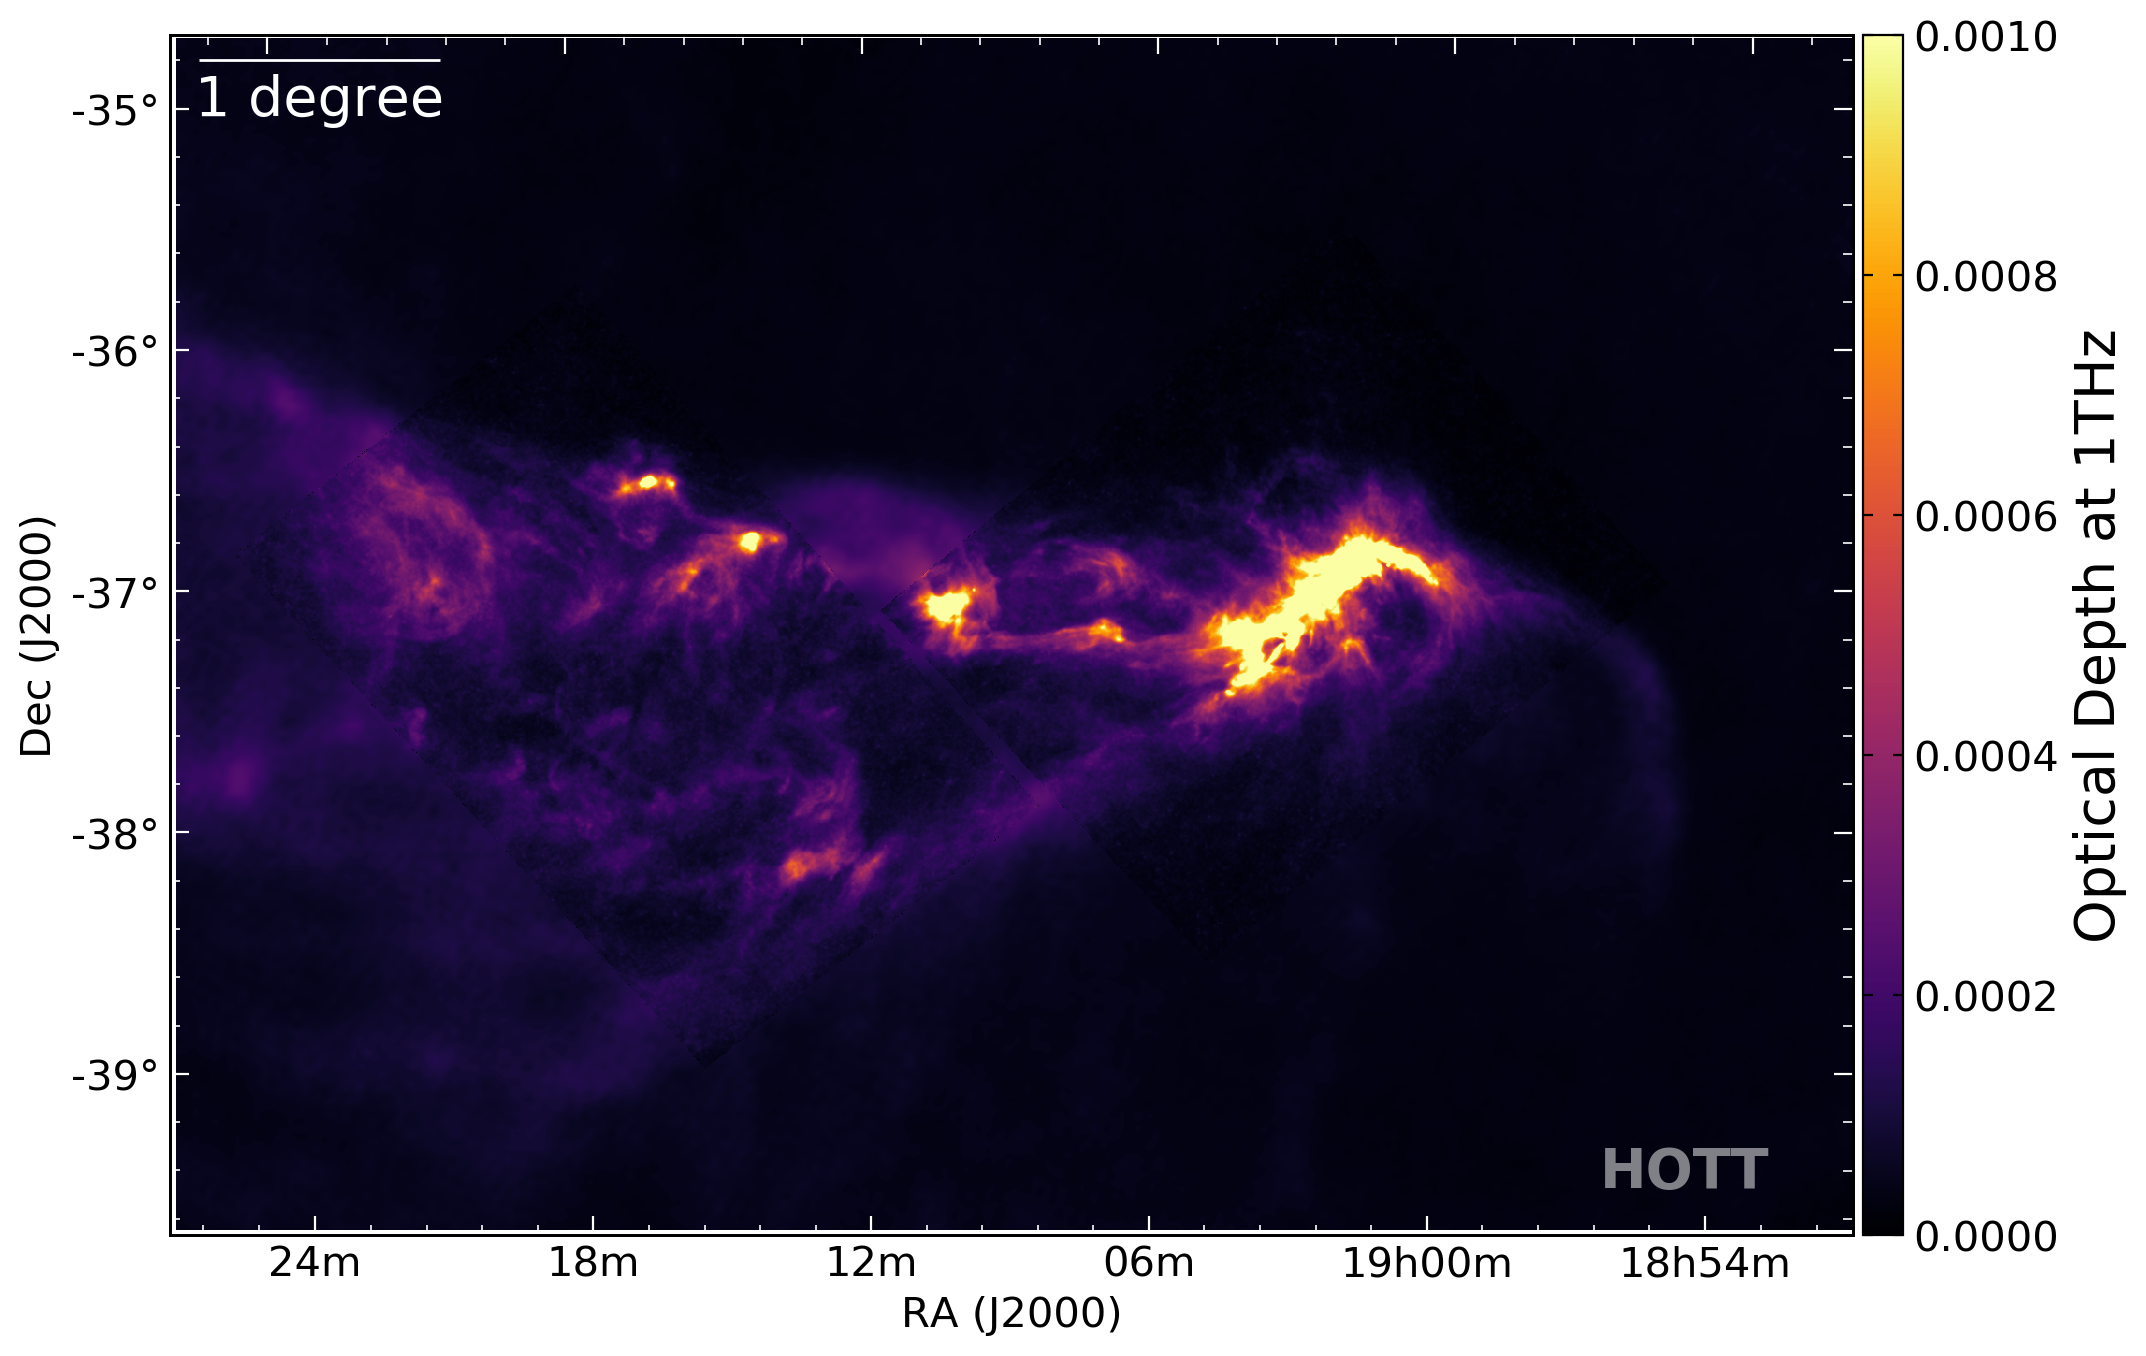
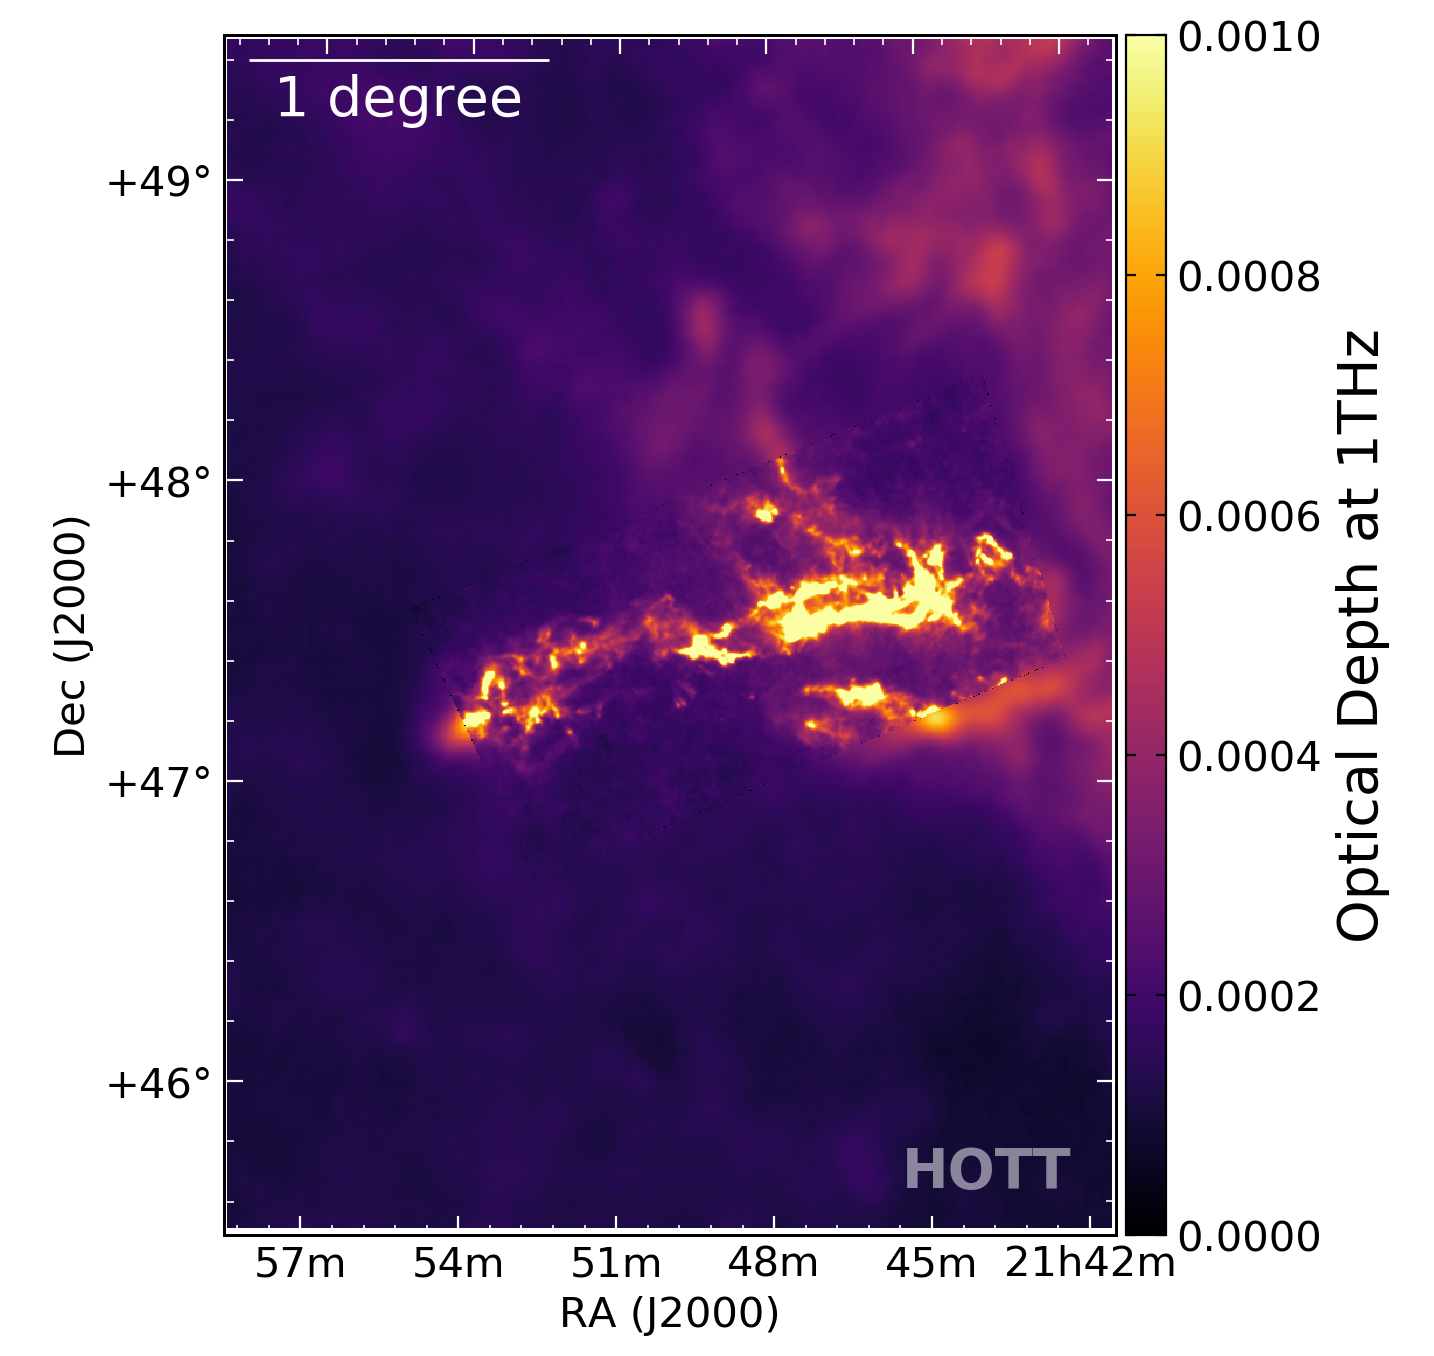
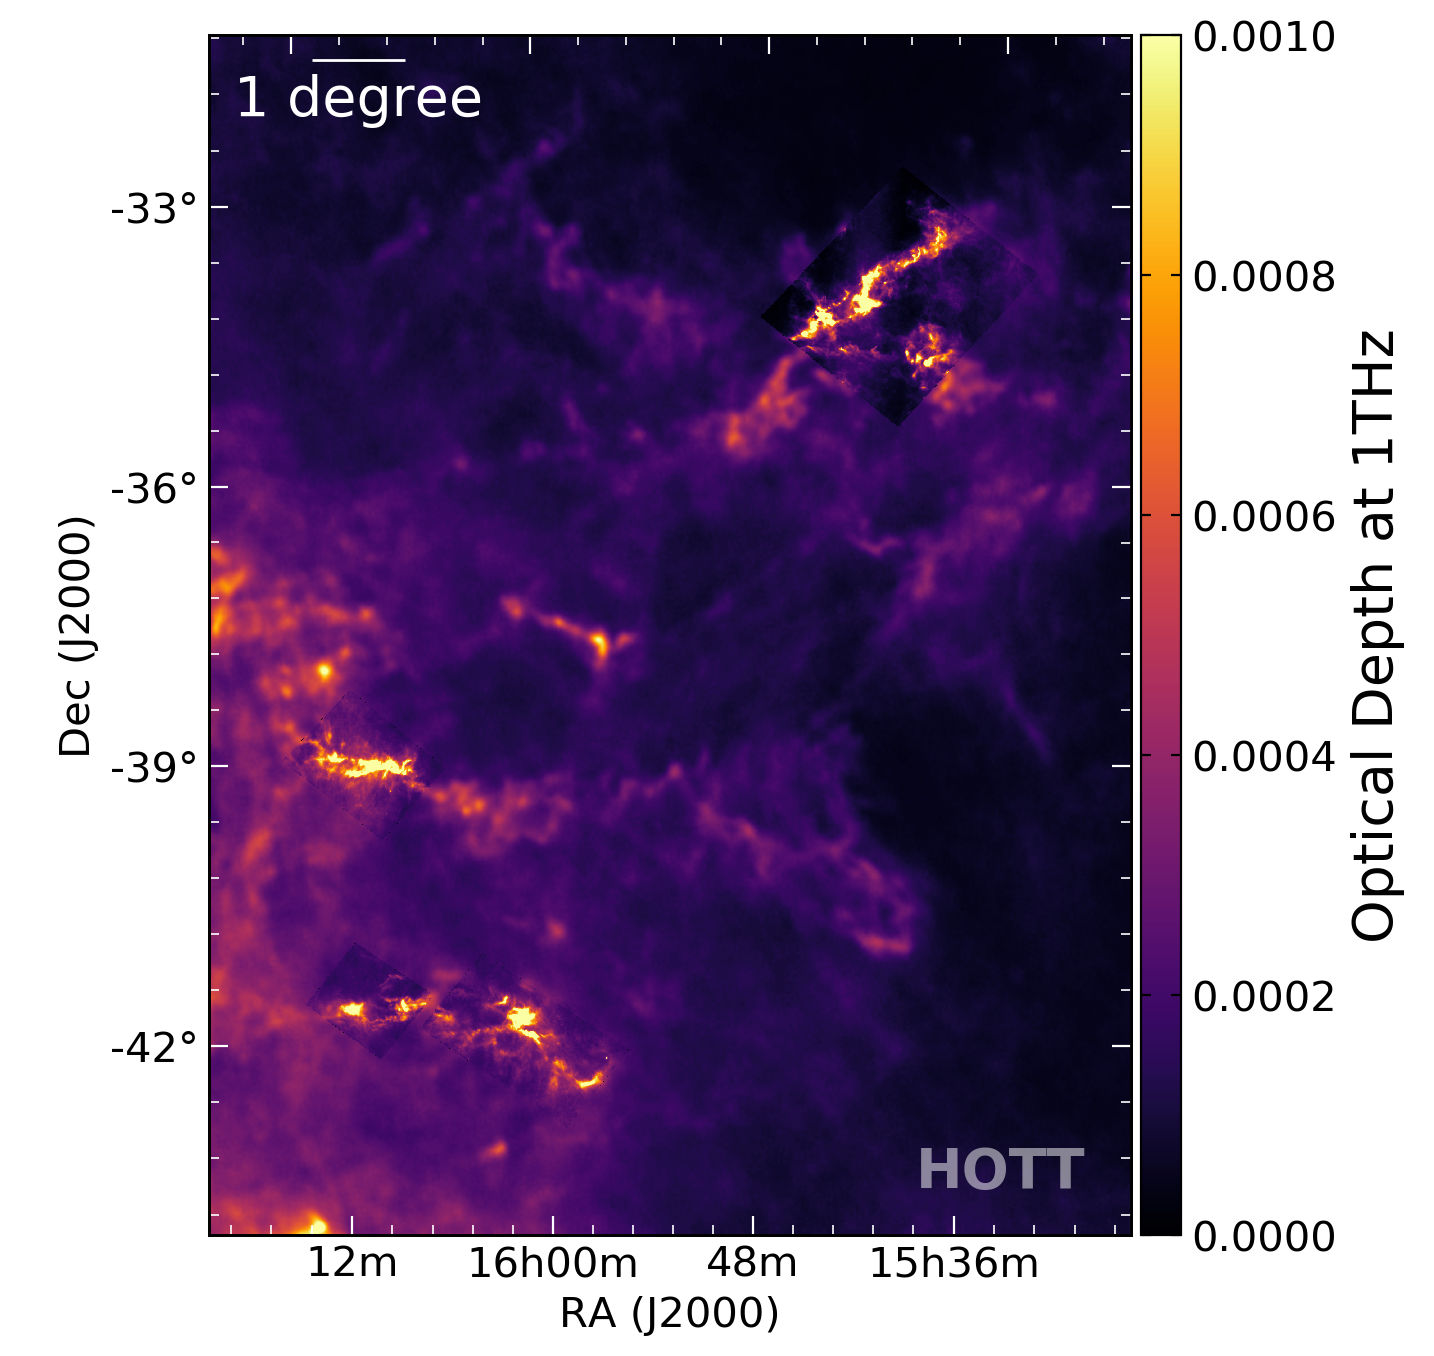
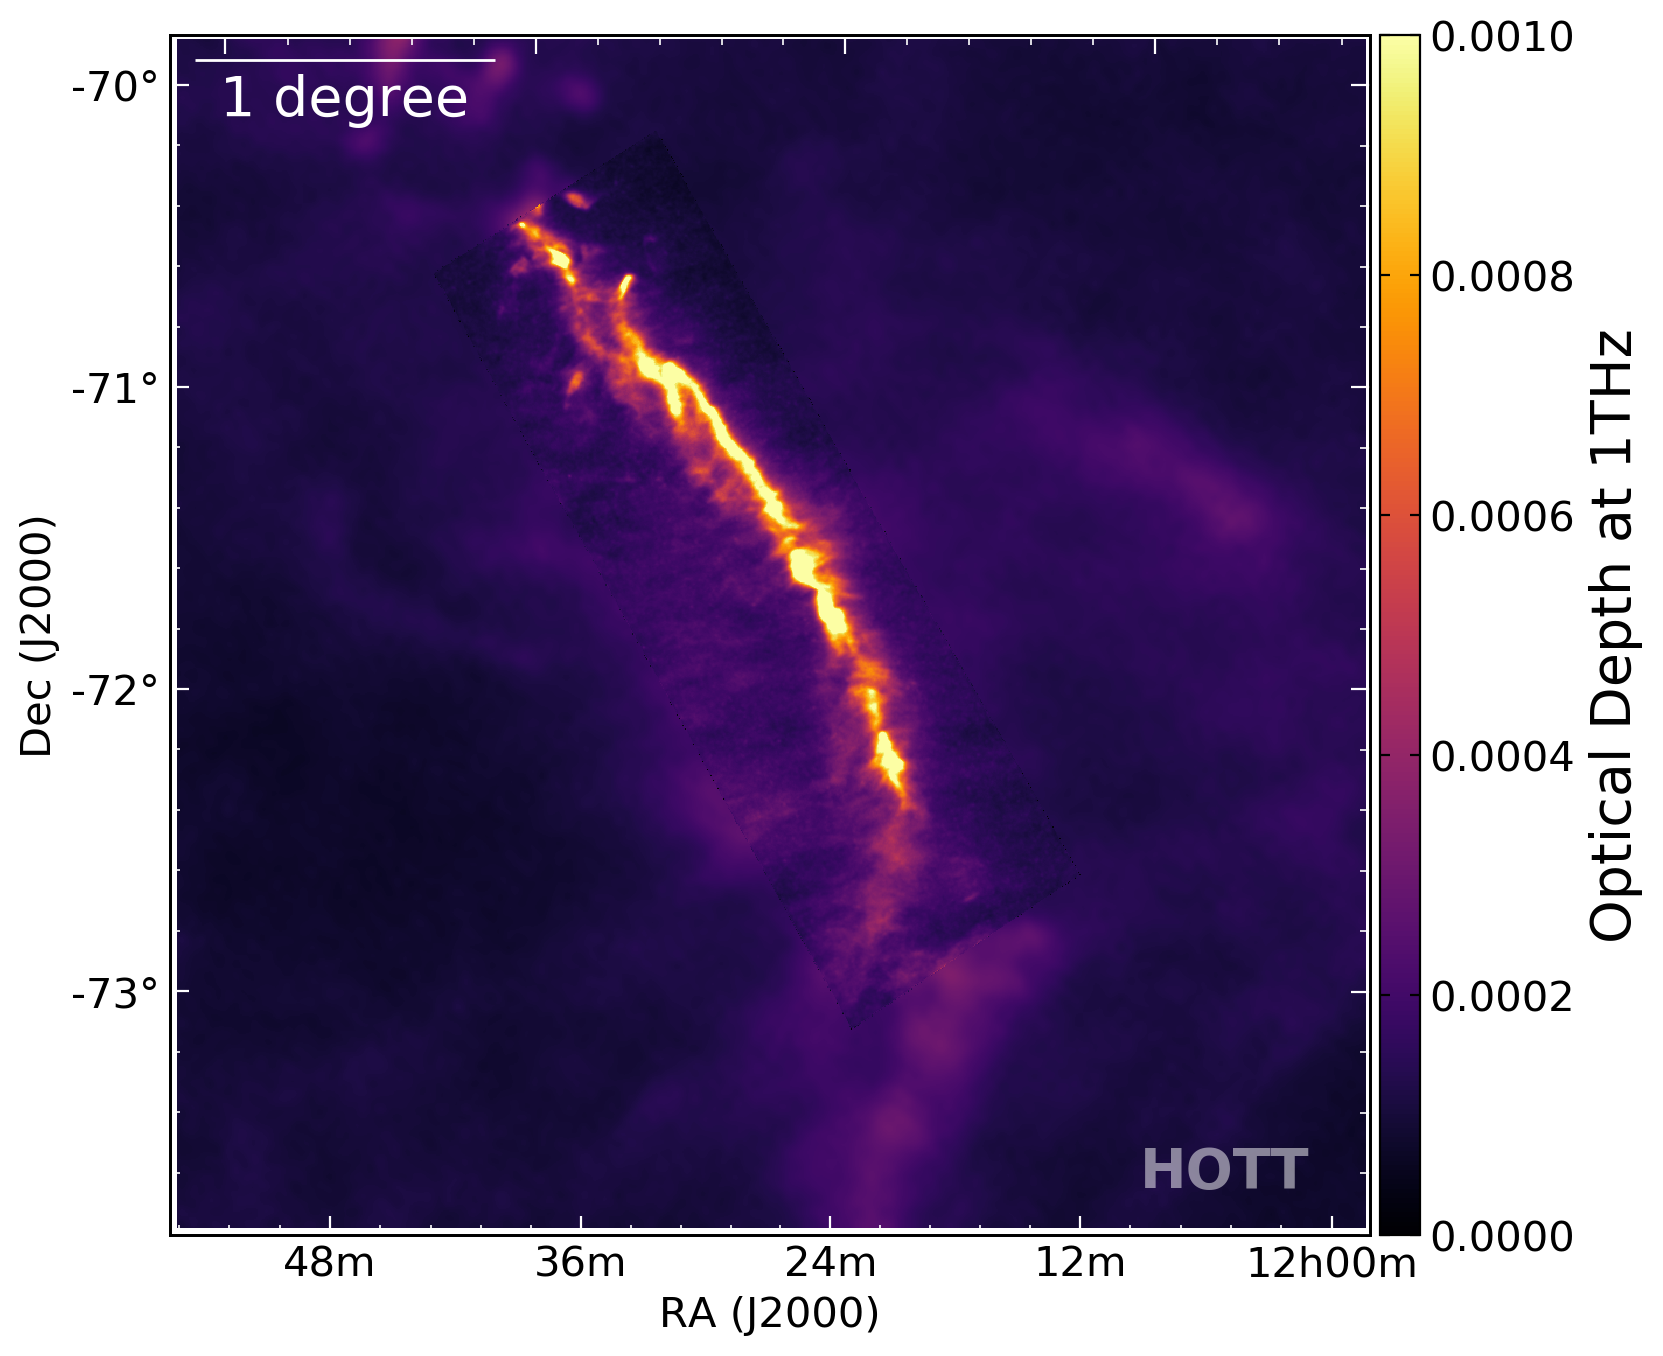
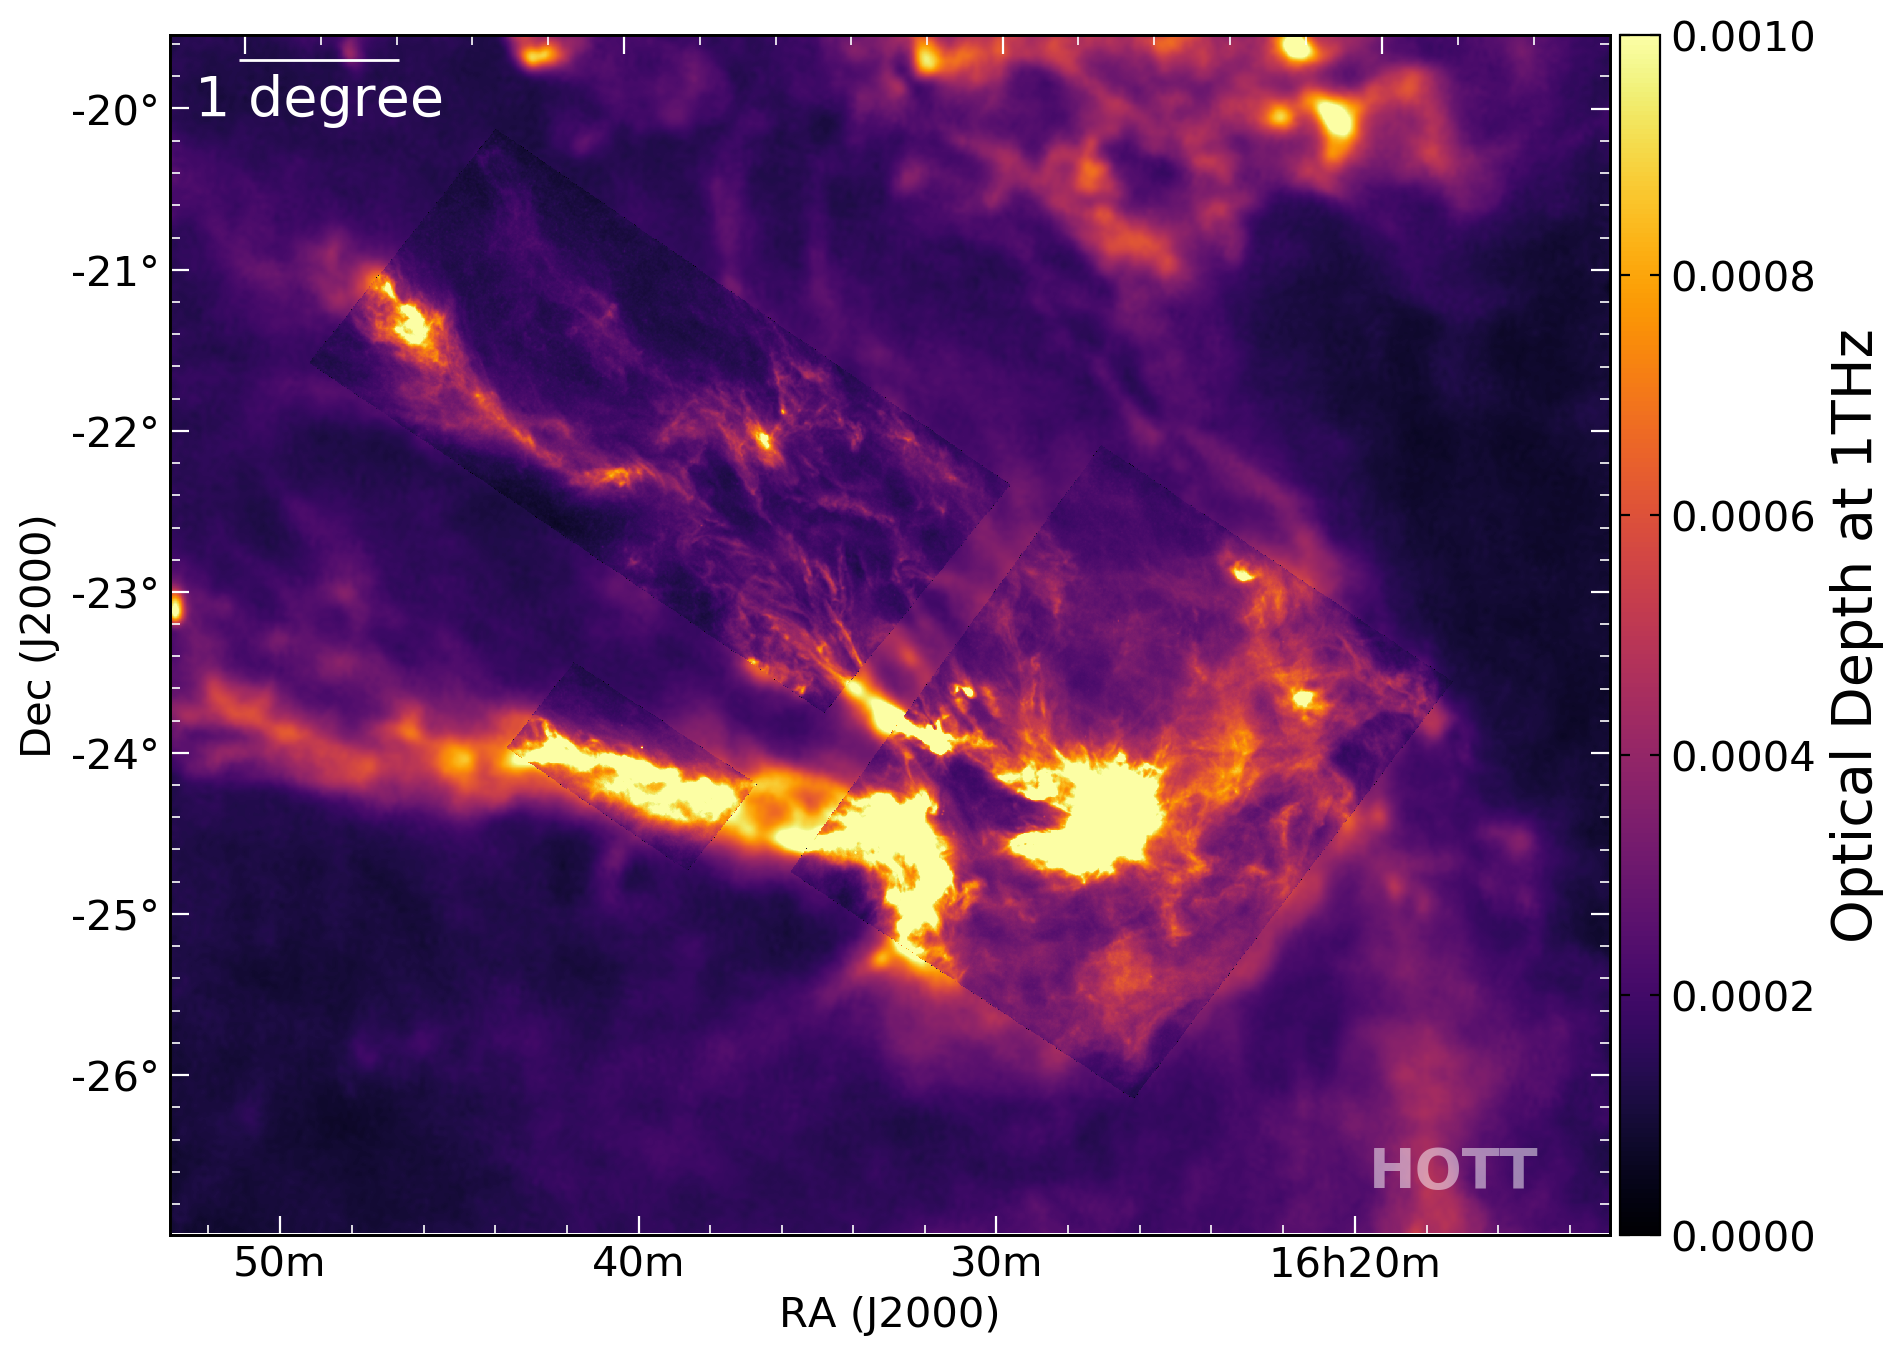
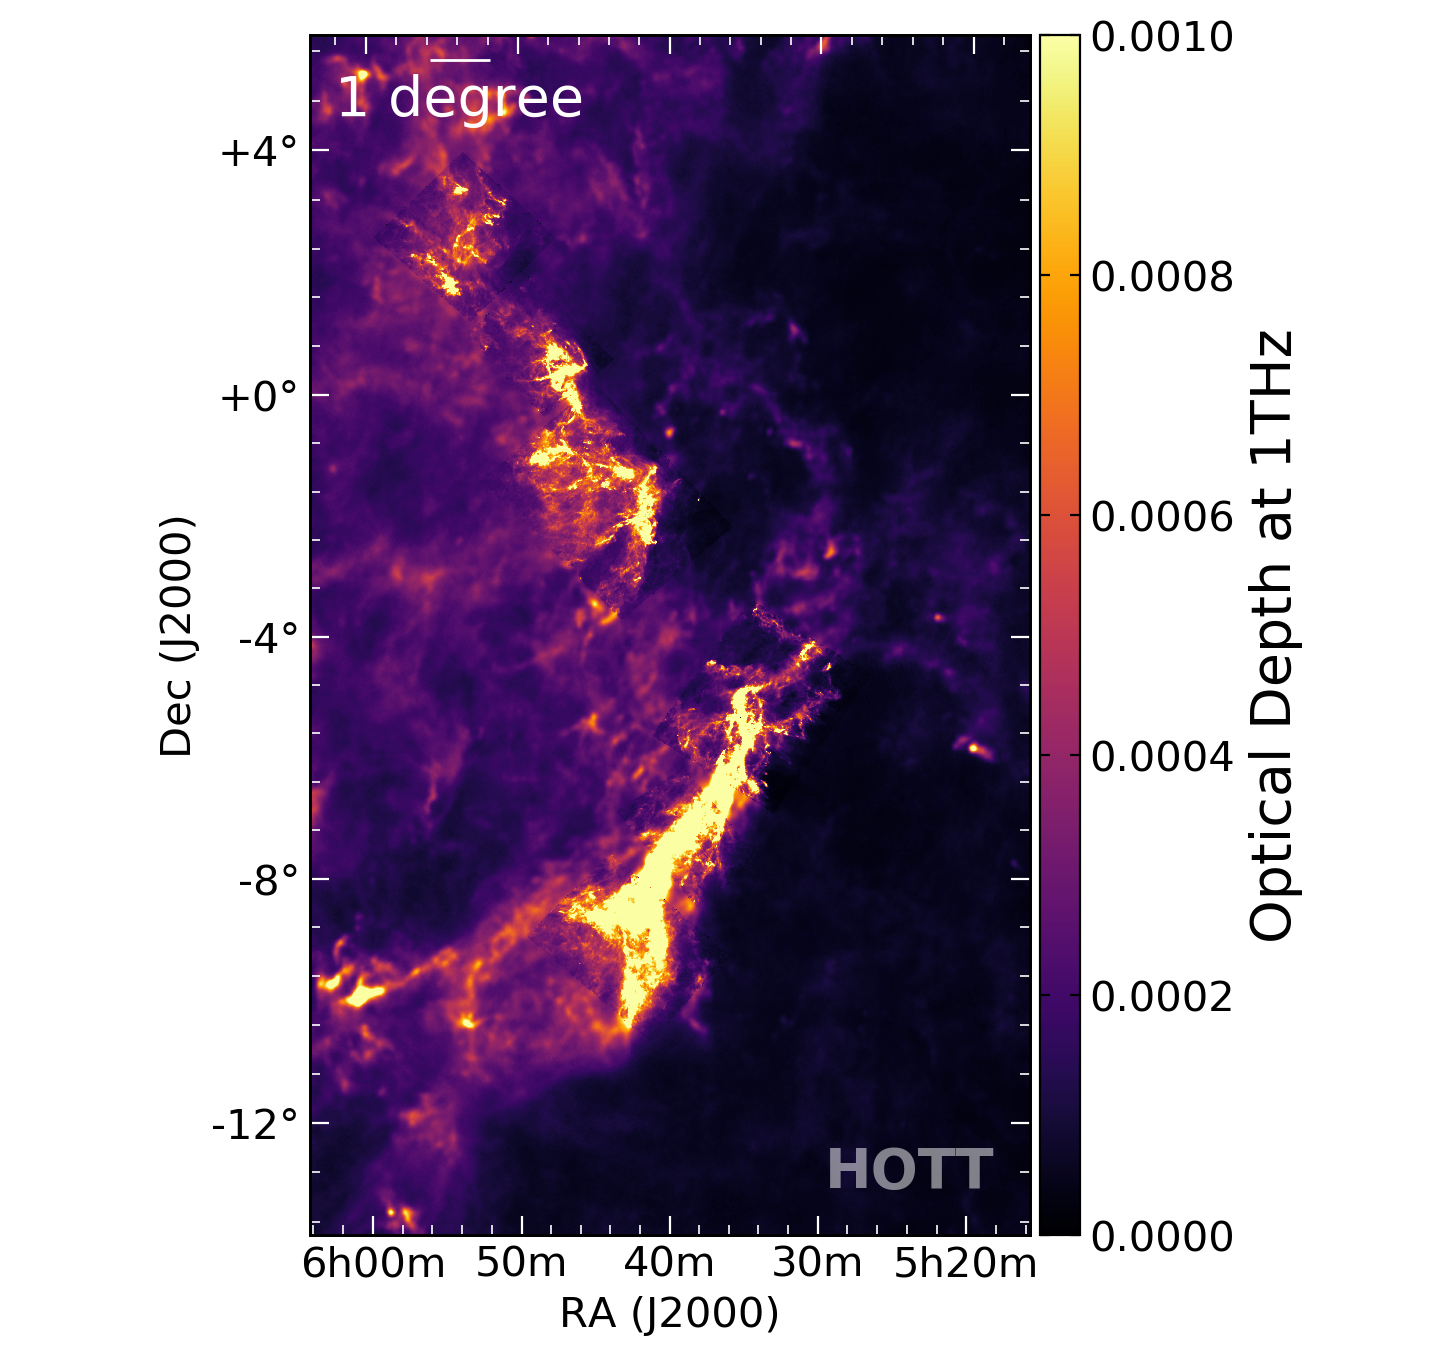
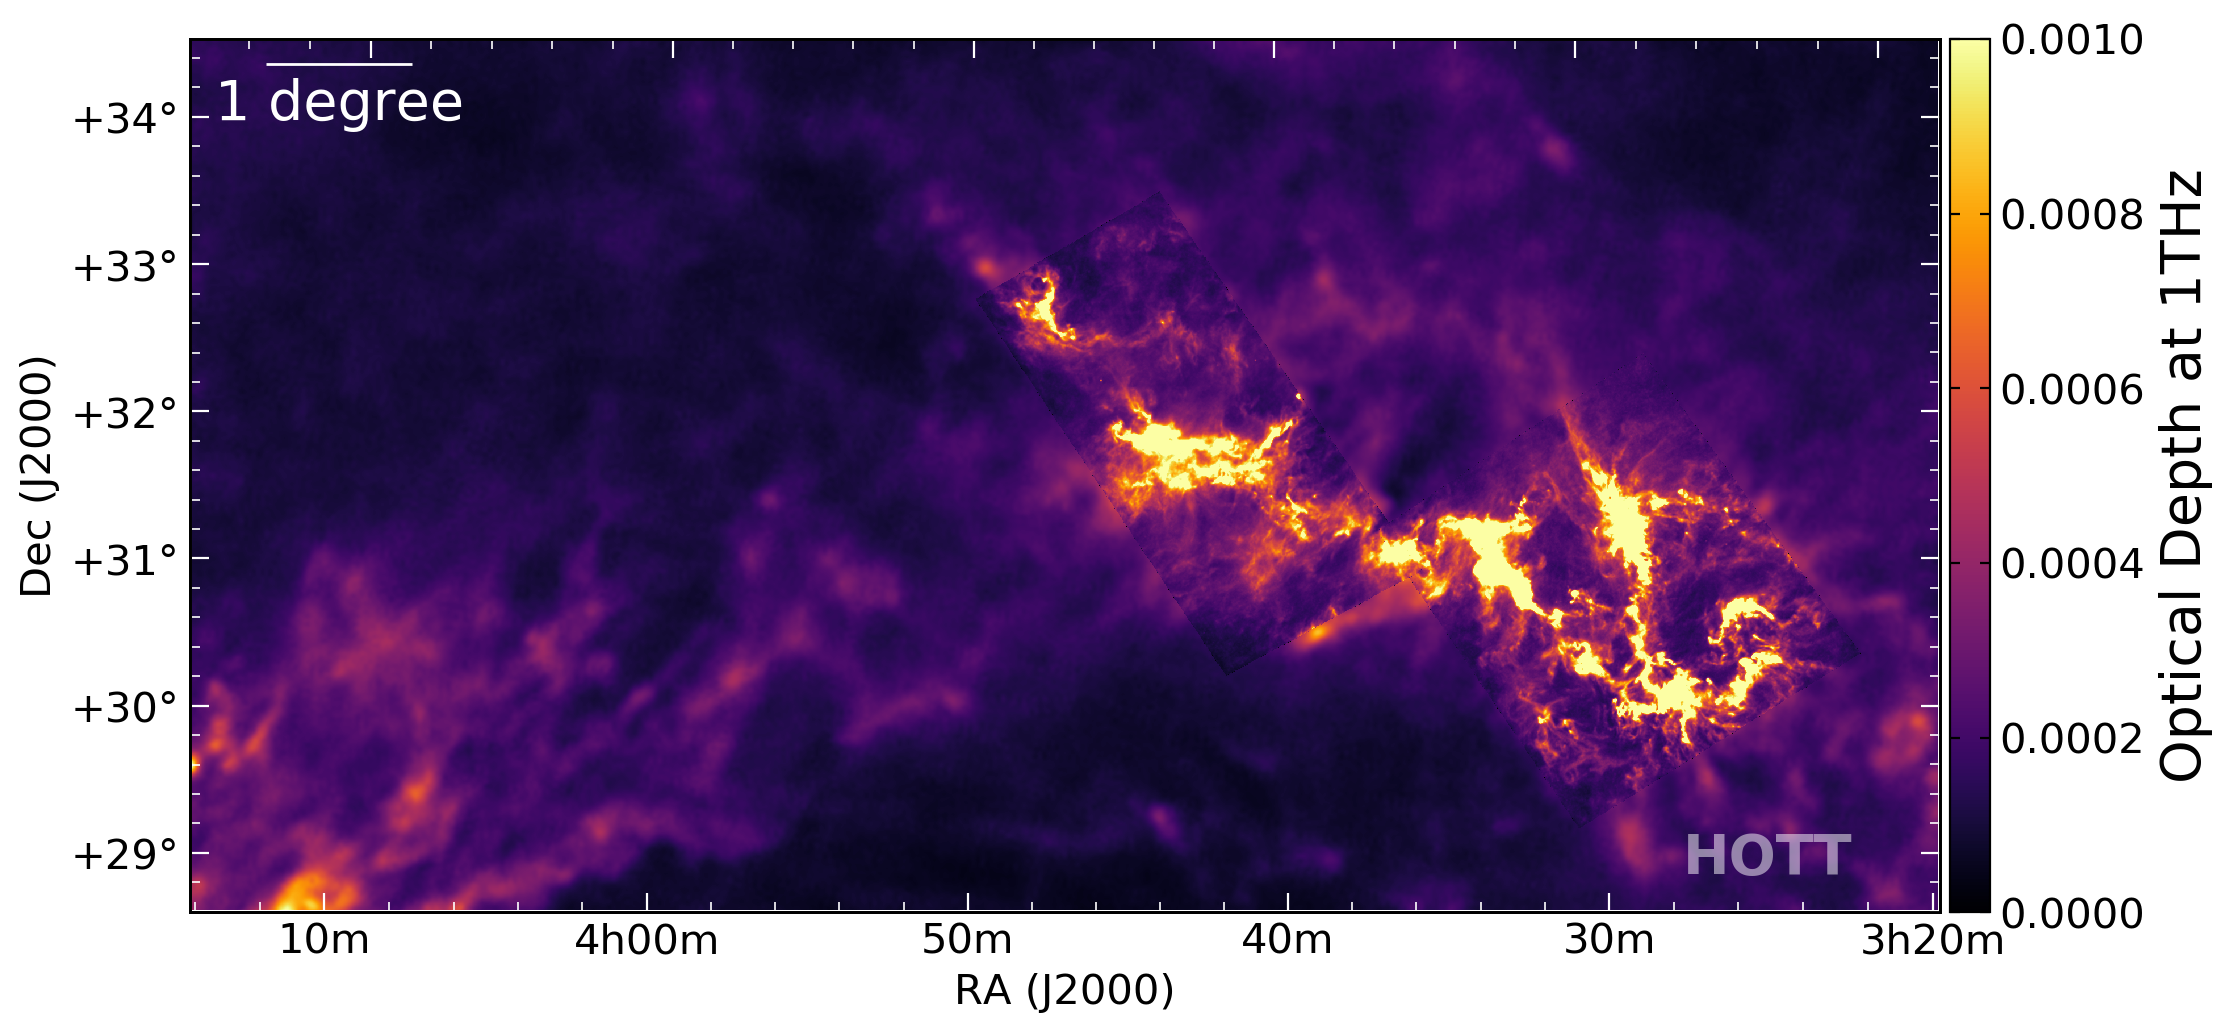
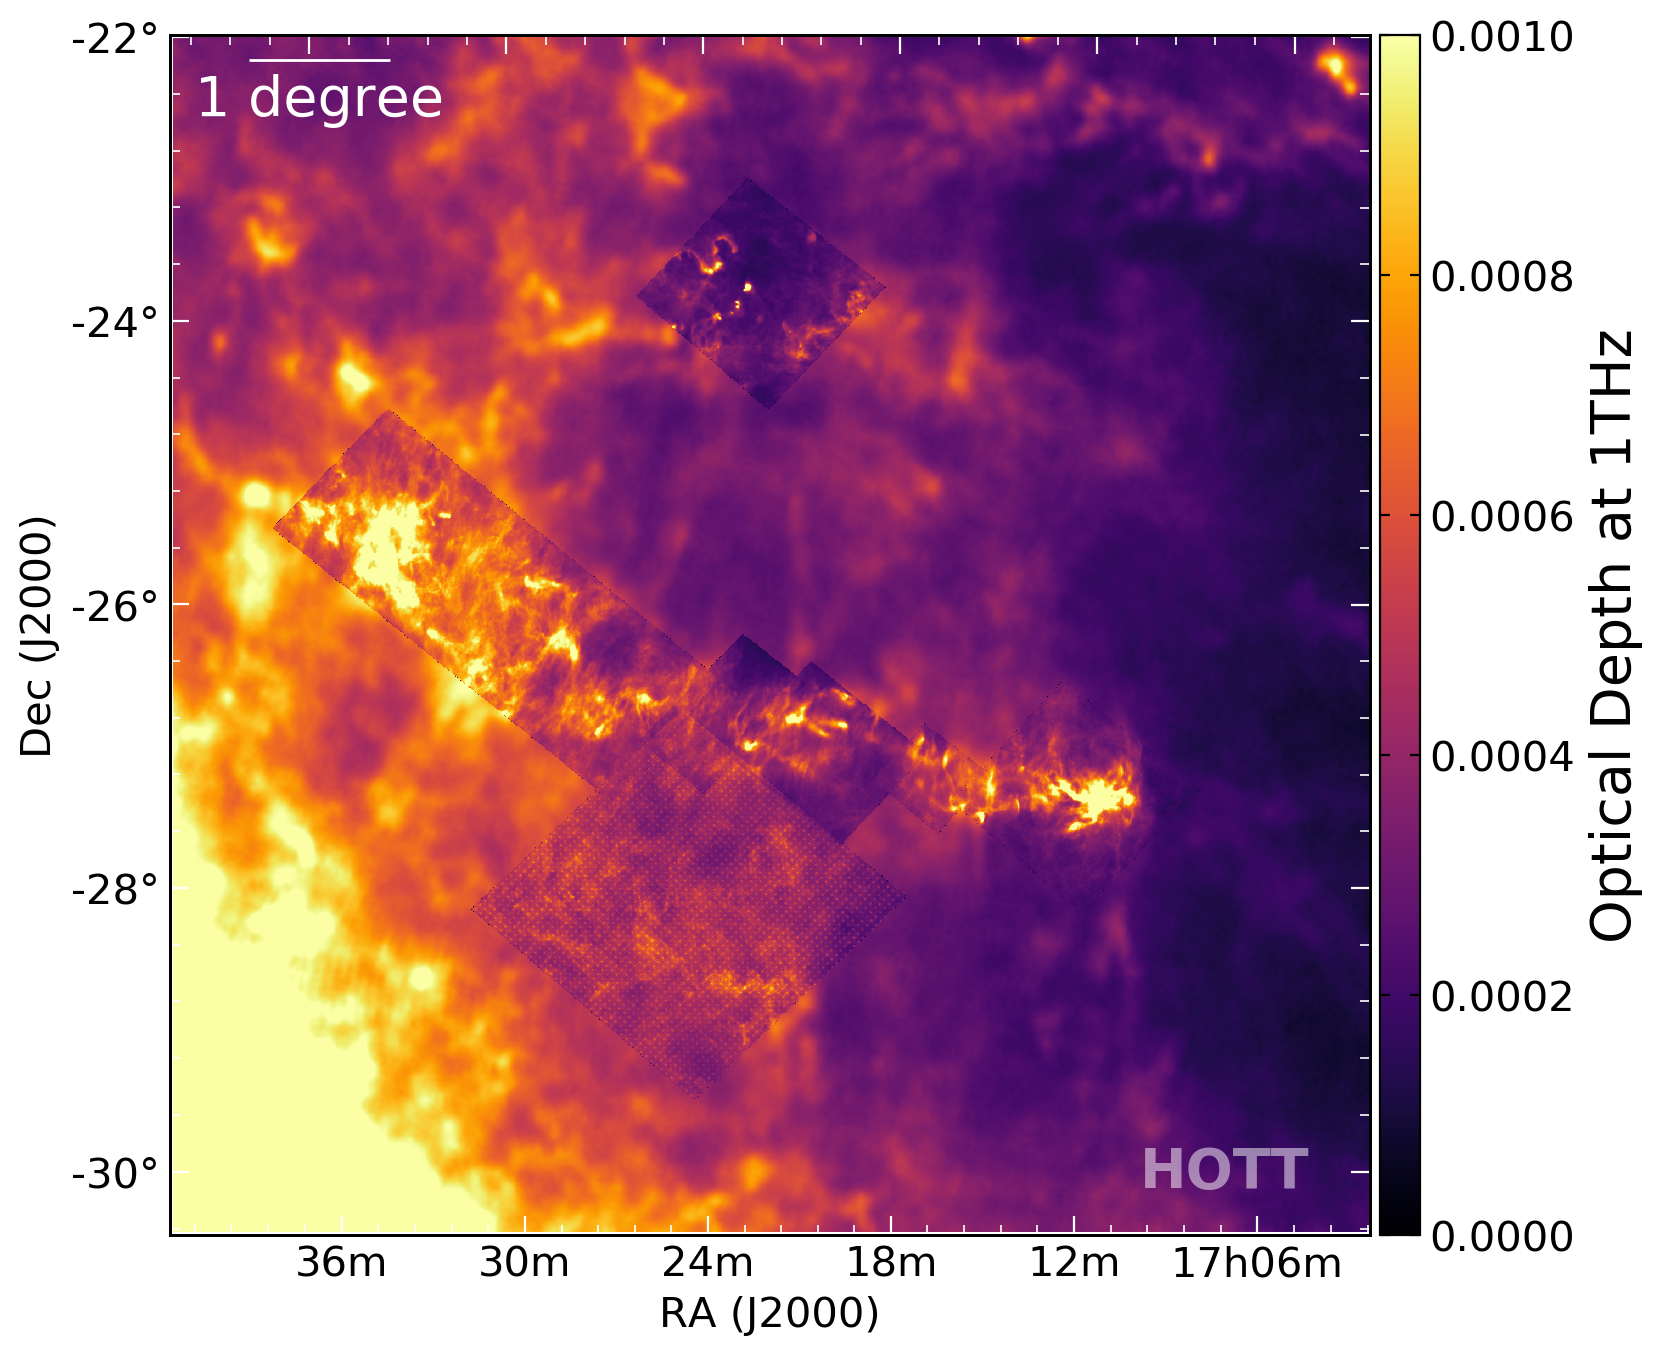
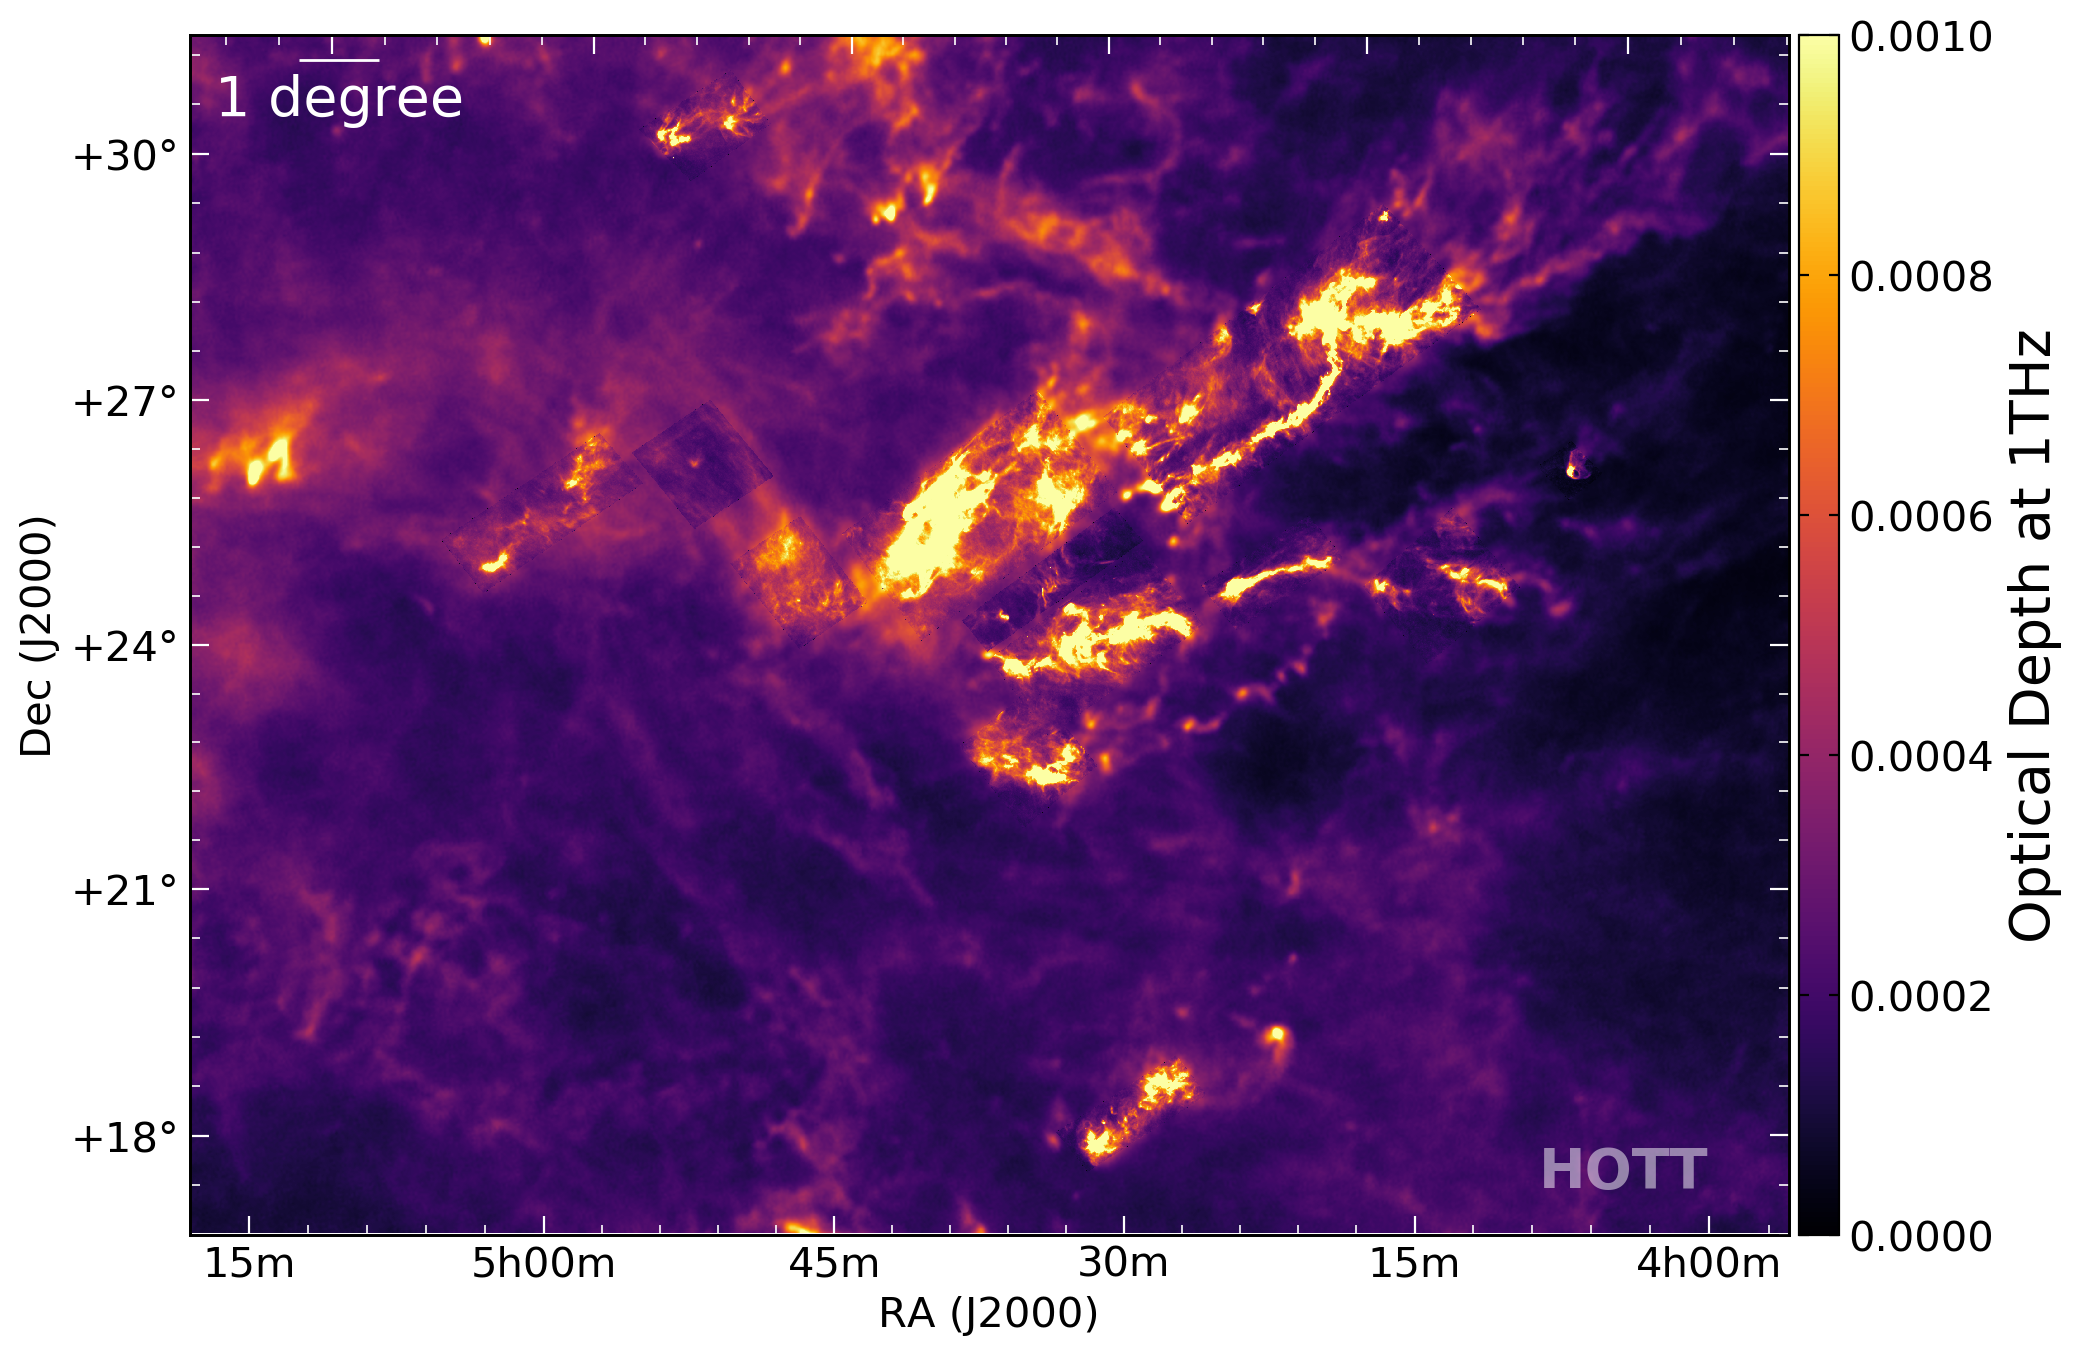
This is an online archive of maps of dust optical depth (τ) at 1 THz and dust temperature (T) in Galactic molecular clouds from Singh & Martin (2022), with an initial focus on the Gould Belt survey regions. These parameter maps were generated by fitting a modified blackbody spectral energy distribution (MBB SED) to submillimetre data from the Herschel Space Observatory. The original intensity maps are publically available in the Herschel Science Archive. The Herschel data used were taken in parallel mode at 250, 350 and 500 µm using the SPIRE instrument and at 160 µm using the PACS instrument, brought to a common resolution of 36.4″ FWHM and pixel size of 14″, the values of the native 500 µm map.
The Planck thermal dust model (Planck Collaboration et. al. 2014) at resolution 5' was used to find the zero level adjustments for the Herschel maps and for a contextual background for mosaics in which the HOTT parameter maps could be embedded. The spectral index (power law exponent β) of the dust opacity for the MBB model was interpolated from the Planck product at 30' resolution.
A comprehensive analysis of uncertainties in the Herschel data provides the basis for an SED fit of the MBB parameters τ and T, using the χ2 metric. The full pipeline with detailed error analysis is described in Singh & Martin (2022). Analysis of residuals from the SED fits across many fields supports the overall appropriateness of the assumed MBB model and points to where it breaks down. Finding χ2 distributions close to the theoretical expectation boosts confidence in the pipeline and the optimized quality of the parameter maps and their estimated uncertainties.
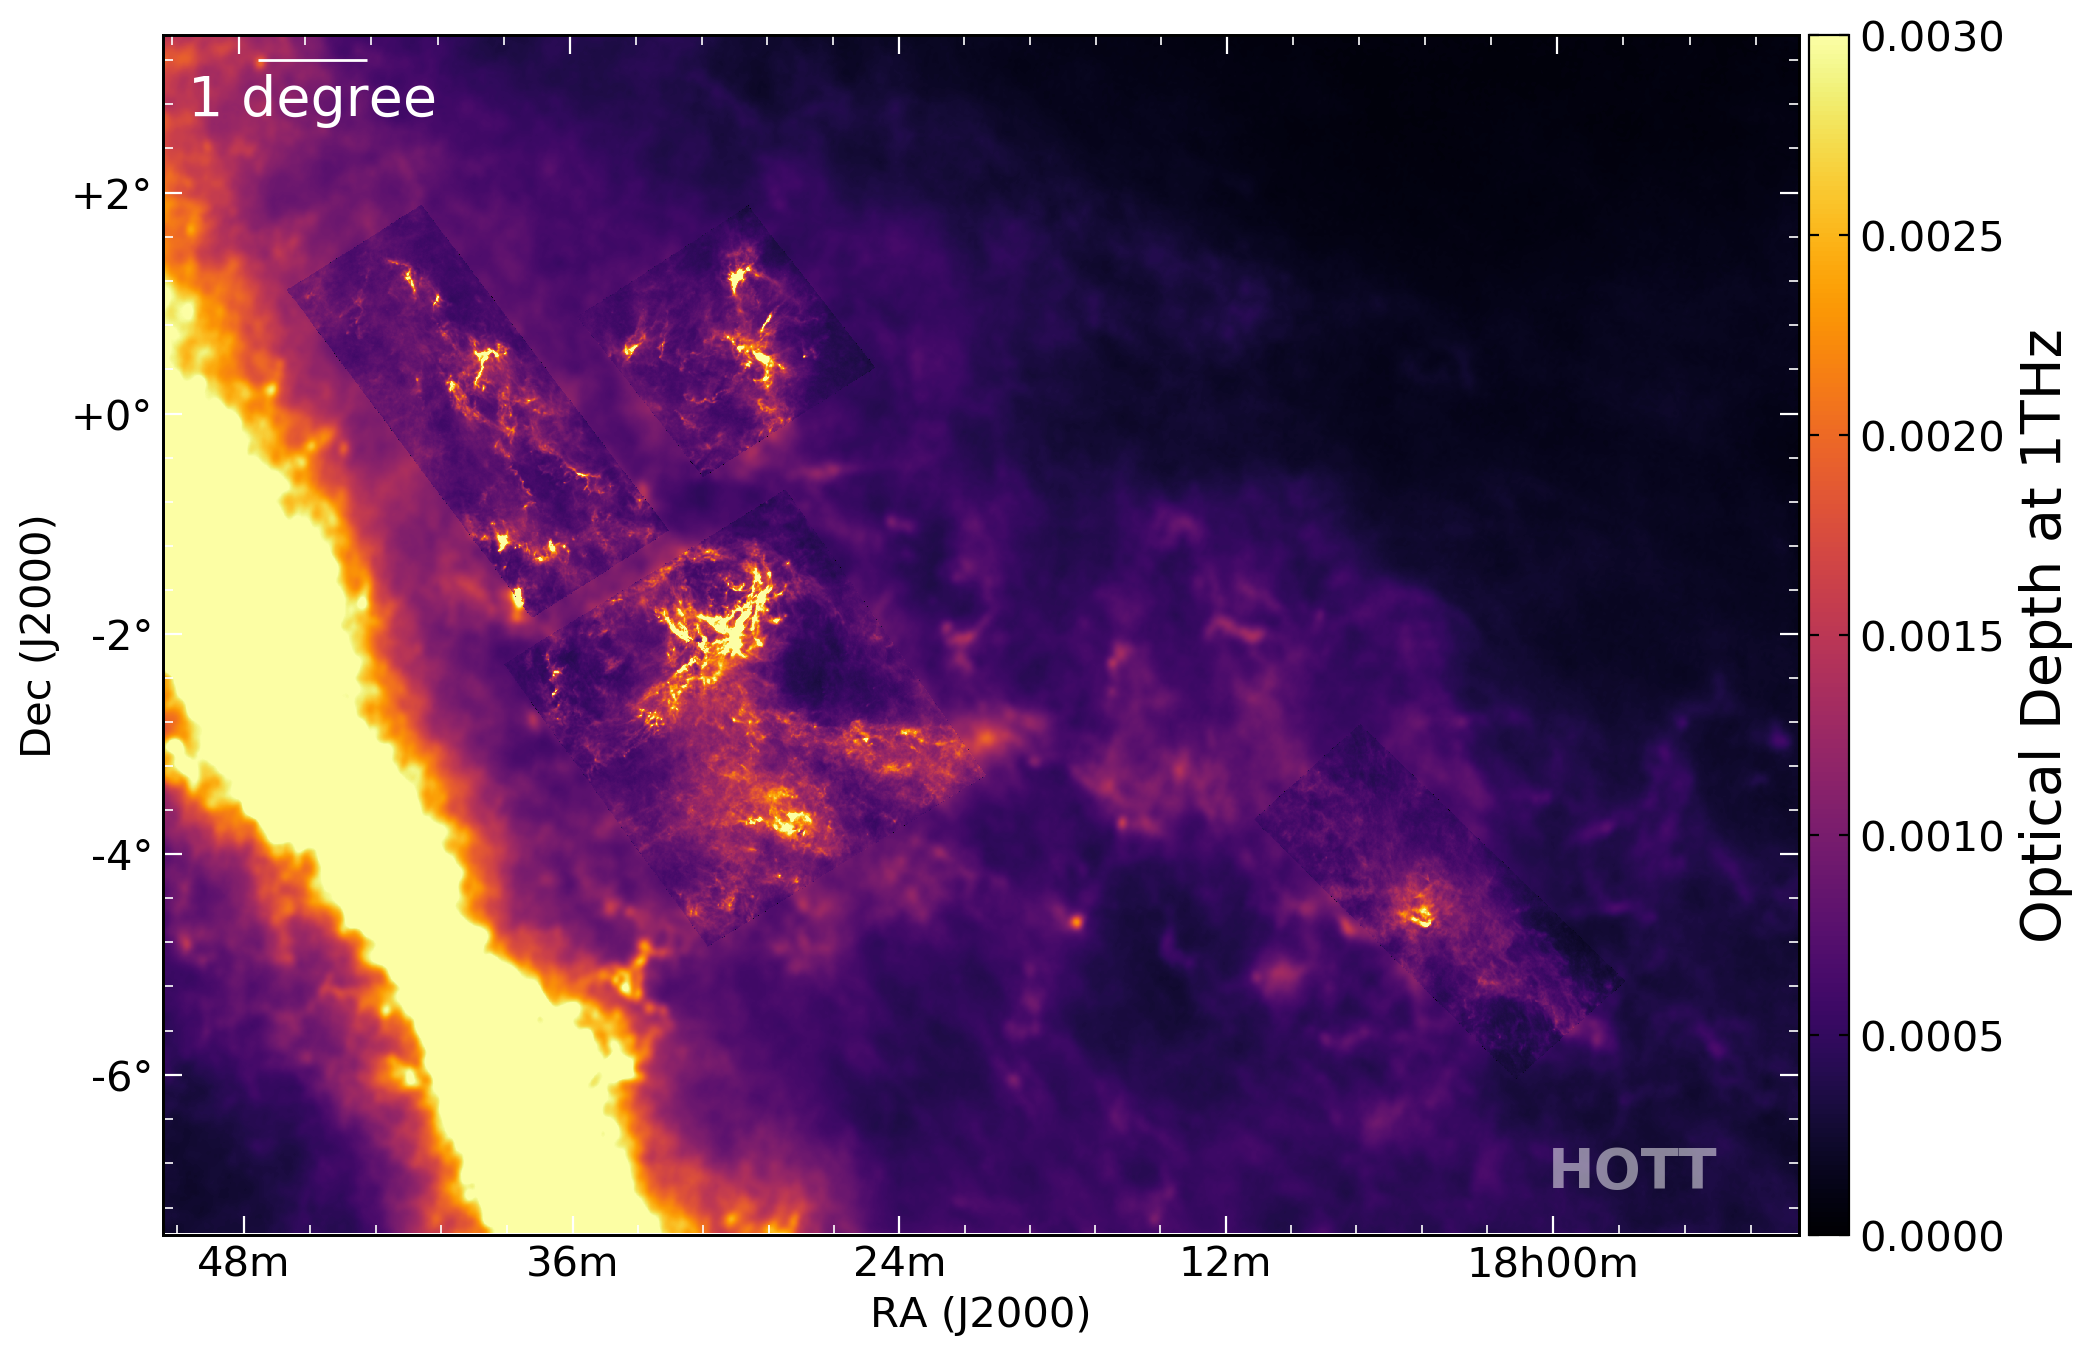
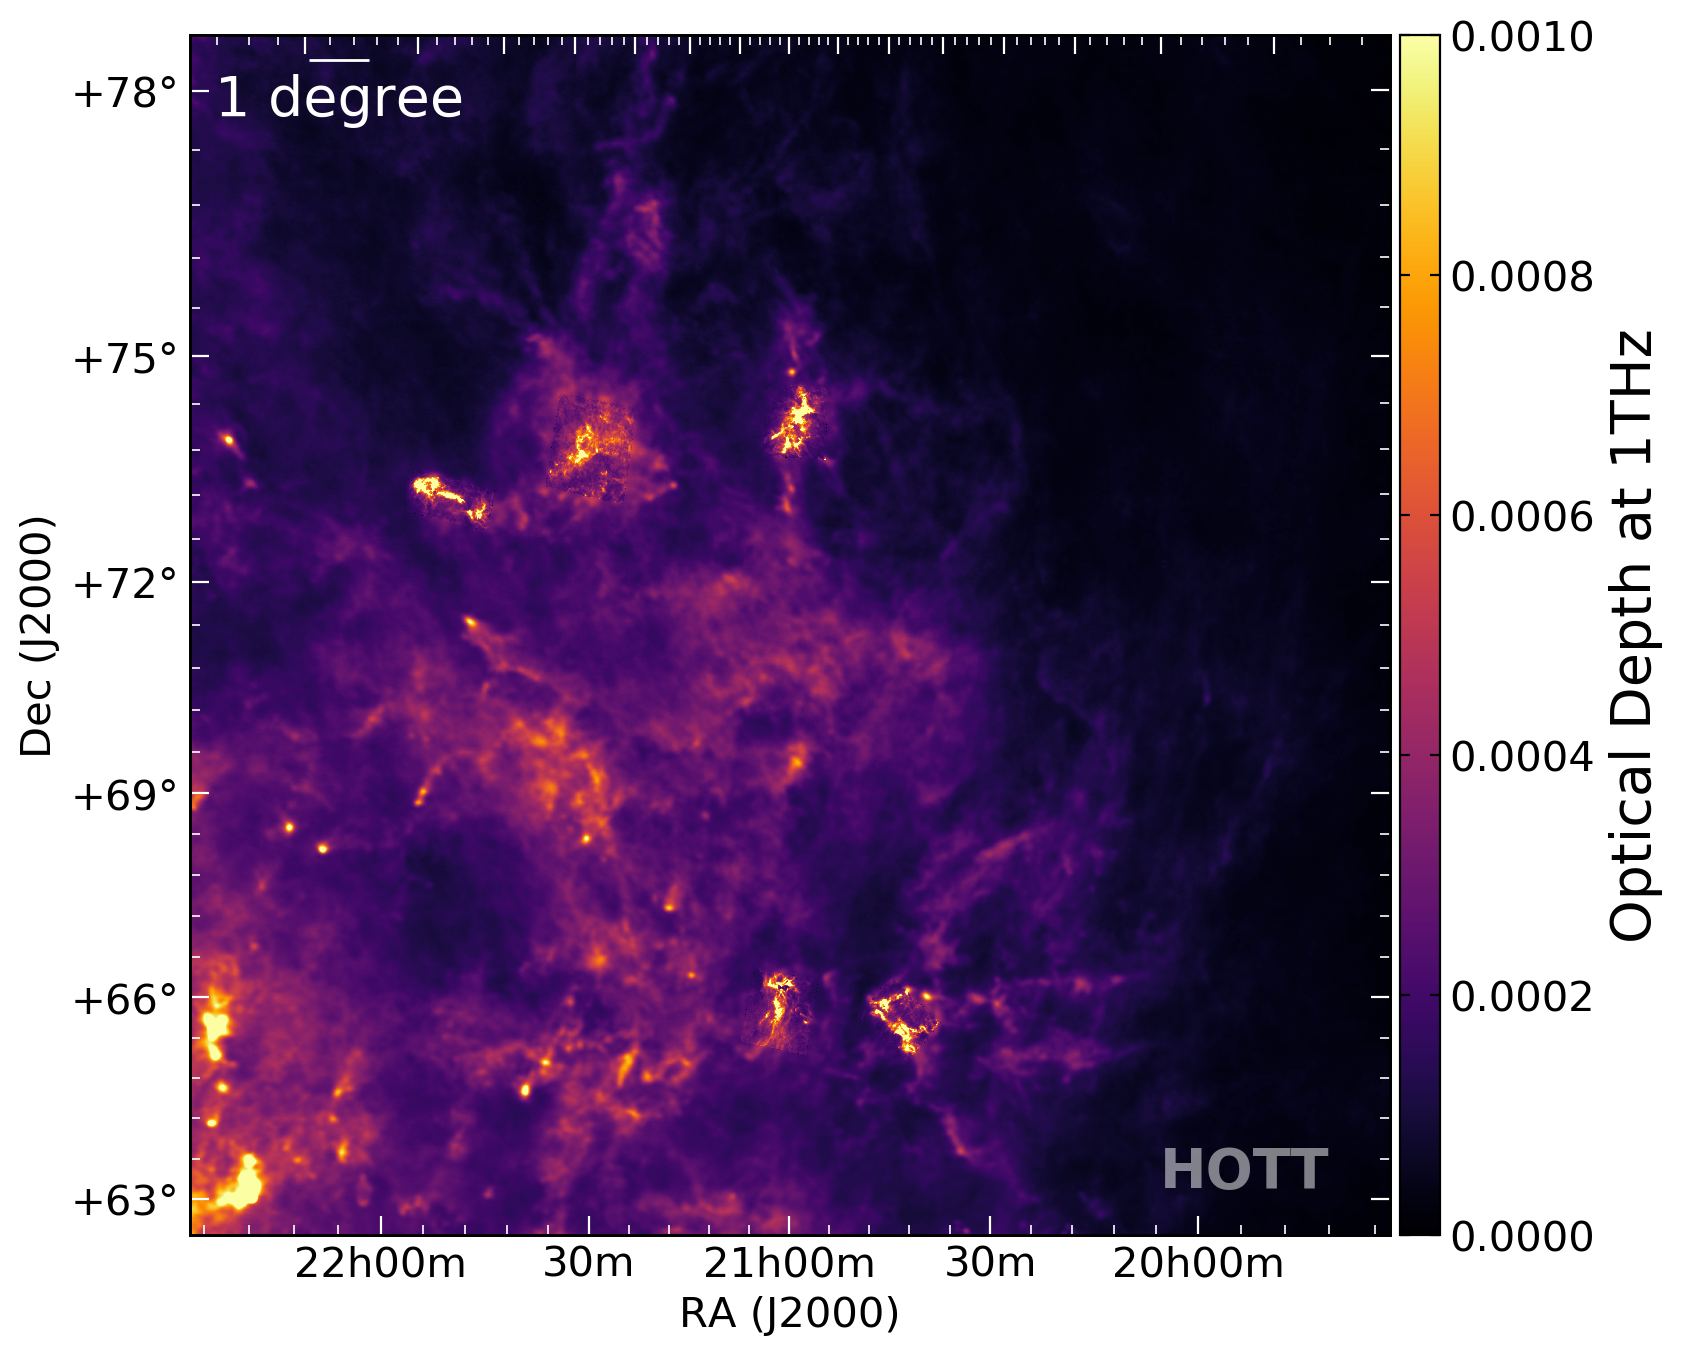
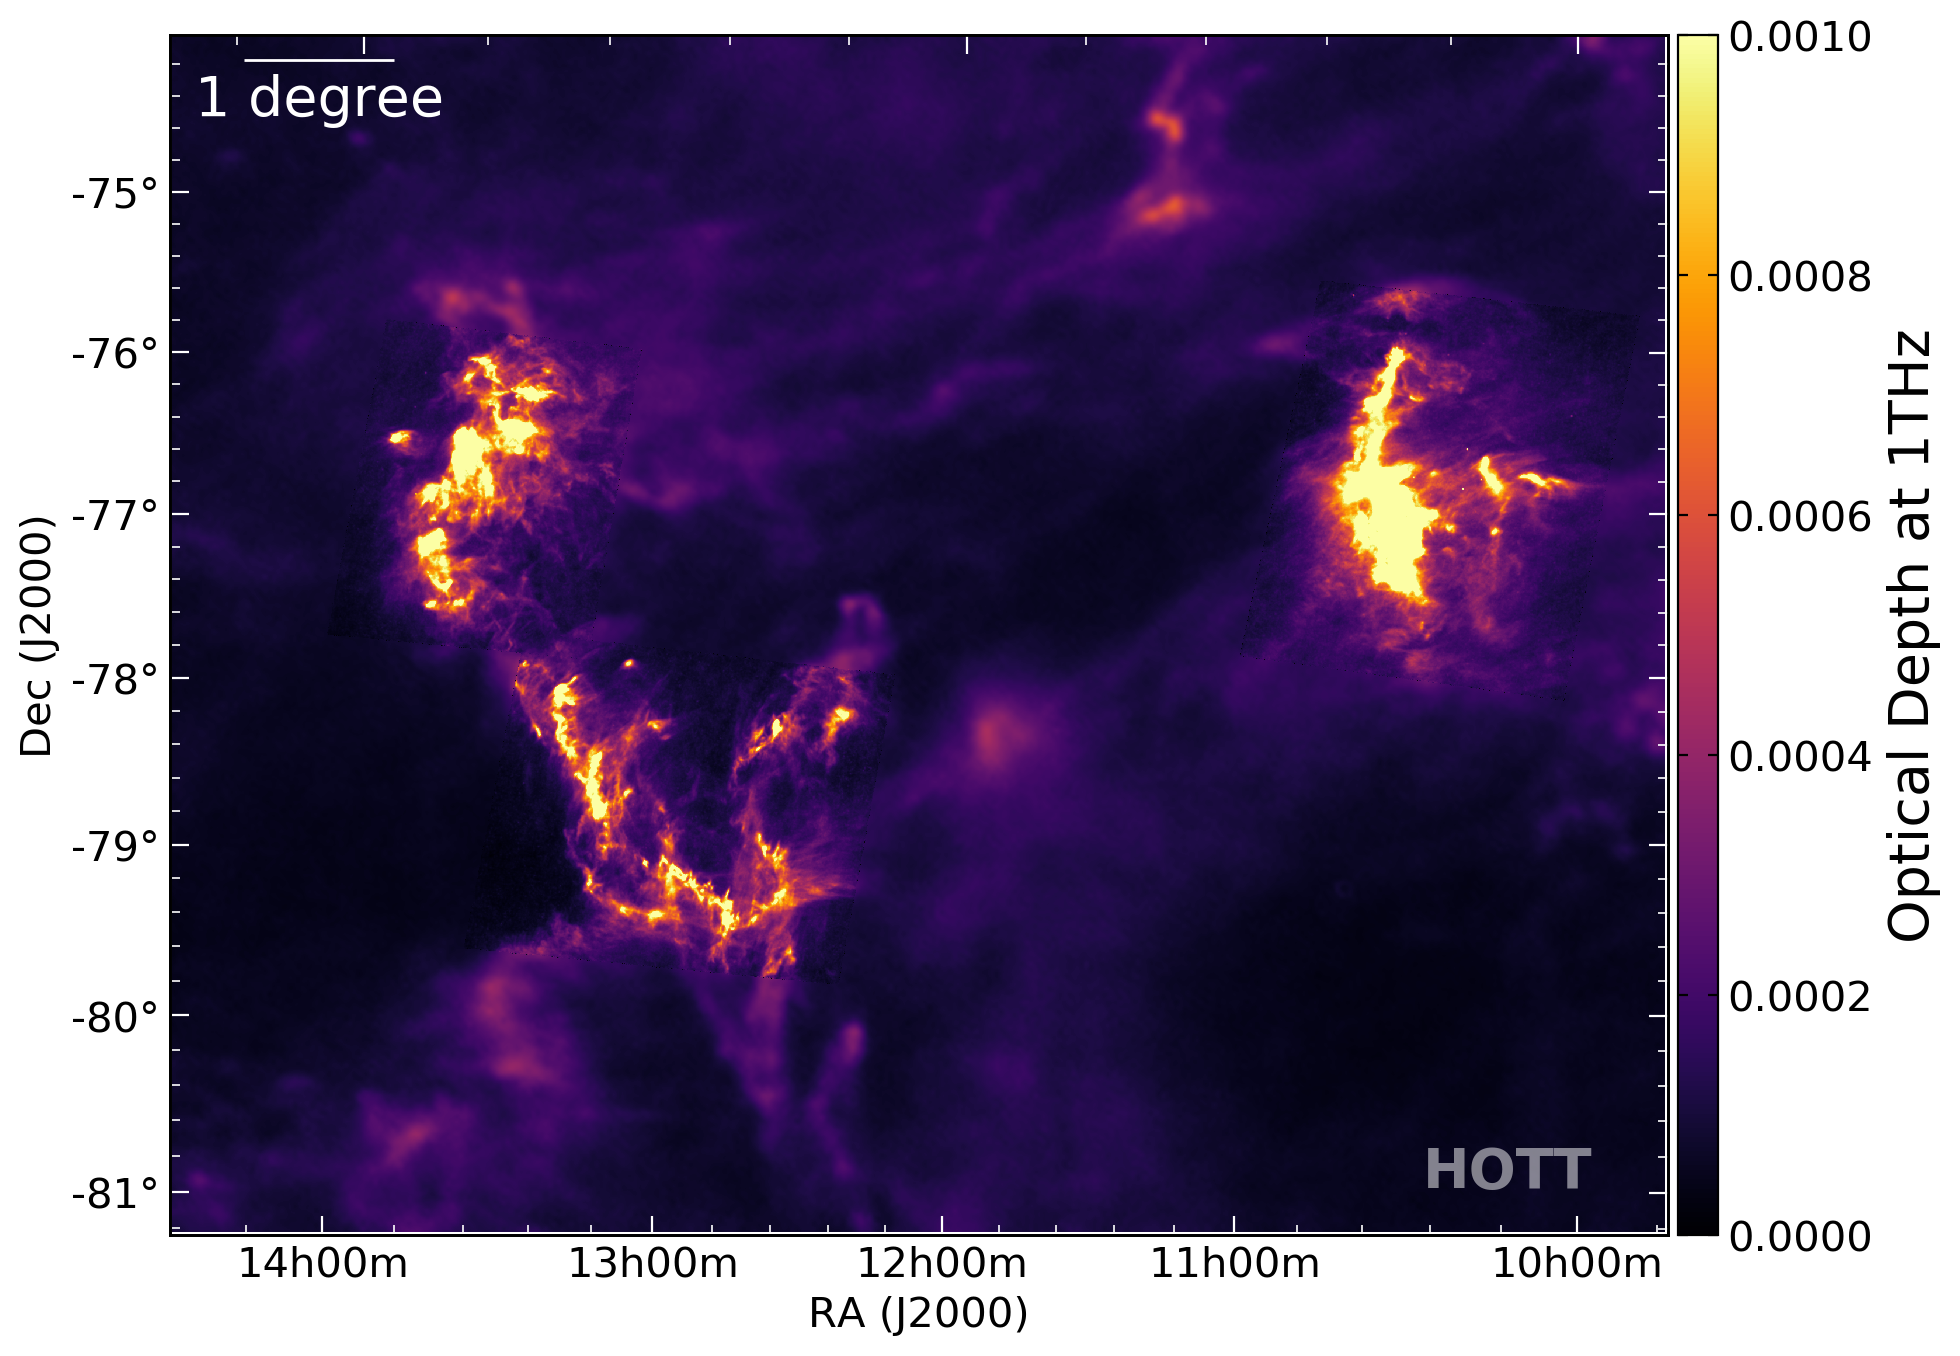
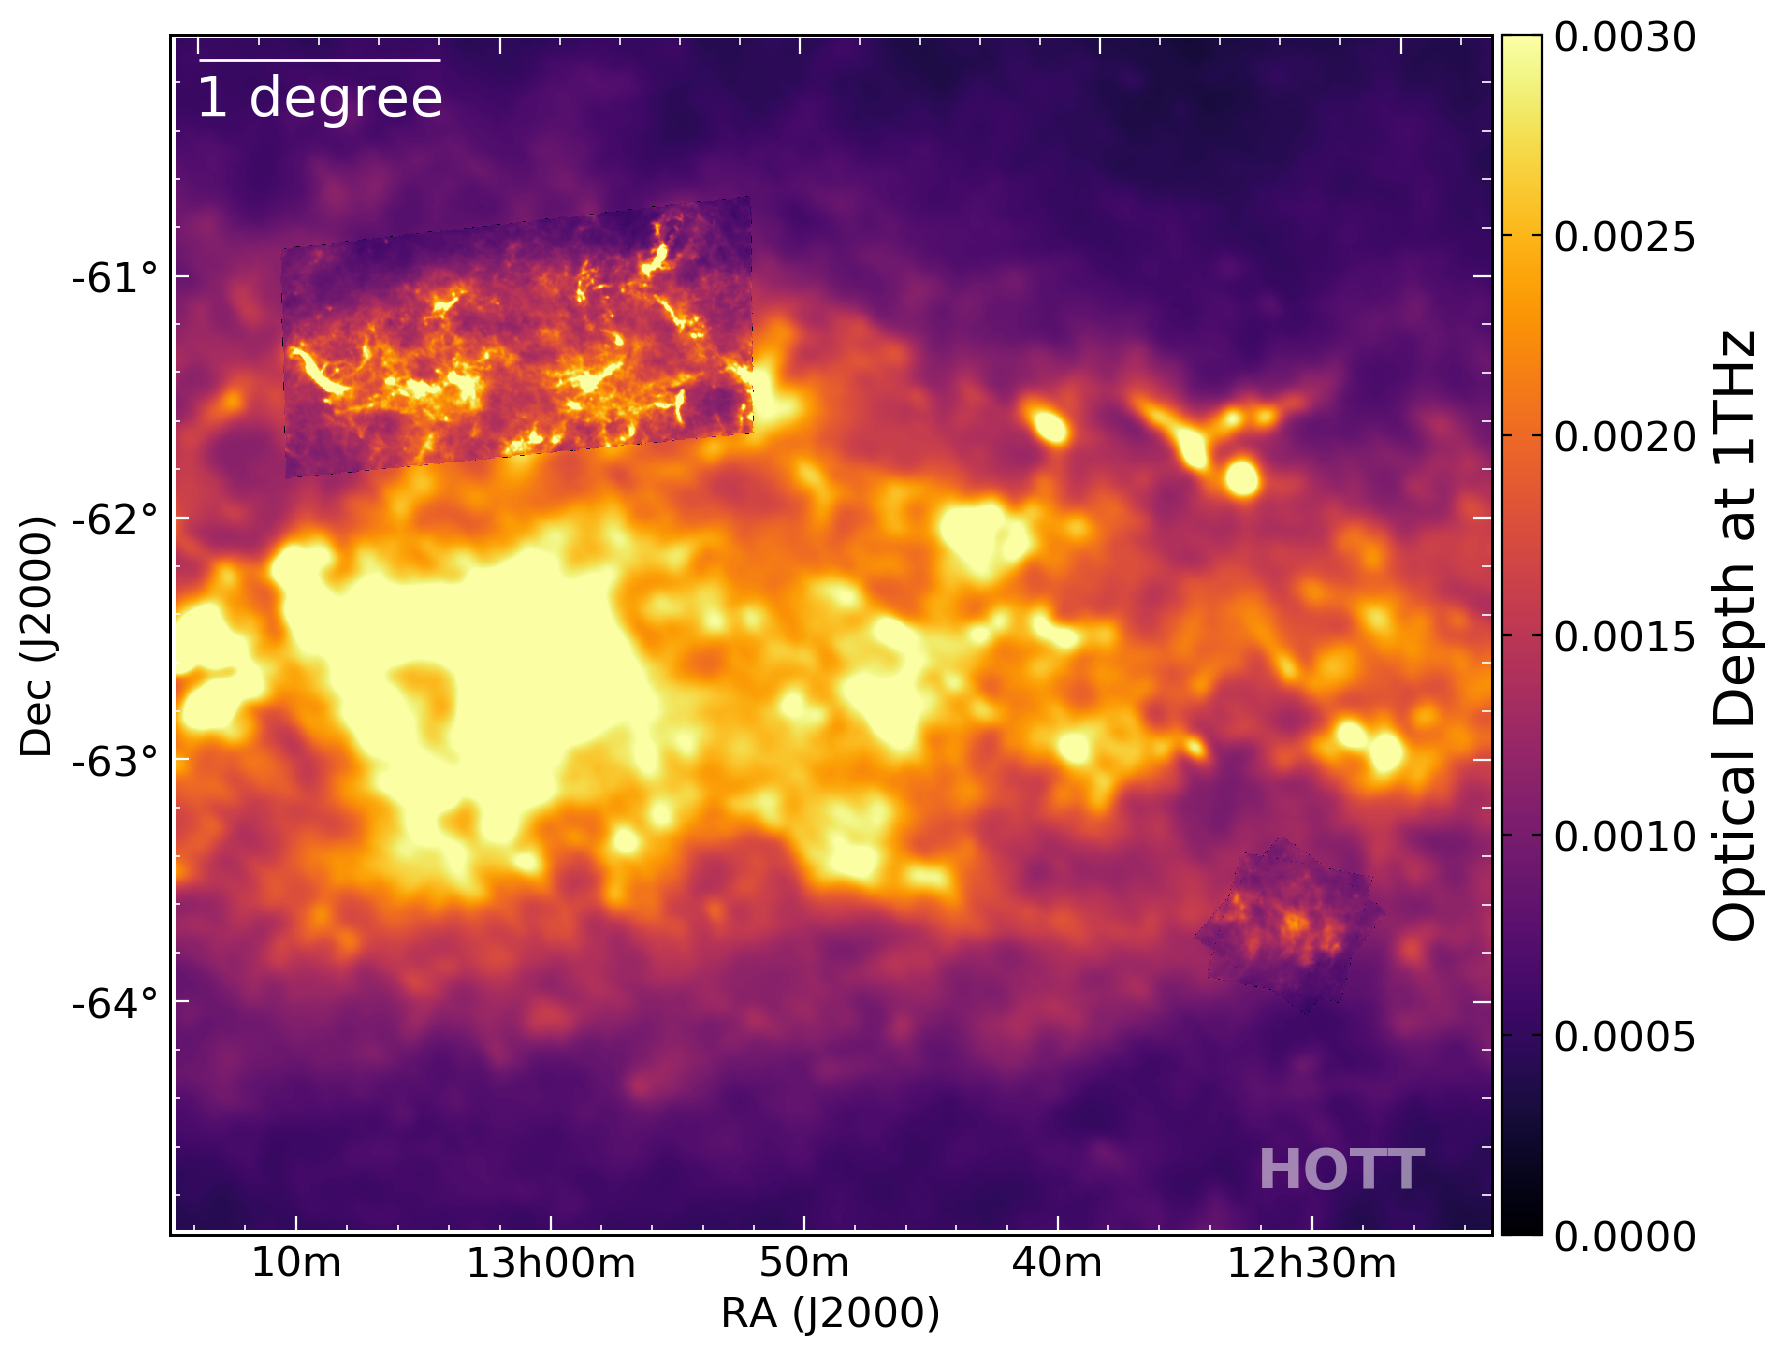
Mosaics of HOTT τ maps embedded for context in lower resolution τ from the Planck thermal dust model provide a contextual overview of all of the regions.
Navigation tips are provided for downloading the HOTT parameter maps for individual fields, and previewing or downloading plots relating to zero-level adjustments and the analysis of residuals and χ2 of the SED fits.
A bibliography is provided. Any use of these data should cite the HOTT paper by Singh & Martin (2022).
See also Additional information.